Tutorial 3: Wrangling Cthulhu data without losing your mind¶
whyqd (/wɪkɪd/) should help you perform crosswalks on any source data. Your challenge is identifying an appropriate strategy.
Learning outcomes
- Develop techniques for assessing complex source data structure
- Explain and describe reproducible crosswalks for complex data transformation
- Perform staged pivot-based crosswalks and generate a schema-compliant output
SOURCE_DATA are from Human Development Report 2007 - 2008.
These data are long lost from the internet, and I maintain a repository for educational use. It is assumed you have
familiarity with Python and Pydantic.
SOURCE_DATA = "https://github.com/whythawk/whyqd/blob/d95b9a8dc917ed119f0b64cb2a3f699e4fee7a8d/tests/data/HDR-2007-2008-Table-03.xlsx"
MIMETYPE = "xlsx"
Background¶
Quote
In 1990 the first Human Development Report introduced a new approach for advancing human wellbeing. Human development – or the human development approach - is about expanding the richness of human life, rather than simply the richness of the economy in which human beings live. It is an approach that is focused on people and their opportunities and choices.
For years I've taught an introductory Data wrangling & validation course using the same training data-series: the Human Development Index report of 2007 - 2008 released by the UNDP as part of the Millennial Development Goals.
The 2007-8 HDI report was listed as a series of about 50 spreadsheets, each dataset aligned with the objectives of the Millennium Development Goals. These supporting information were used to track countries meeting the MDG targets.
These days it's a slick affair with beautifully-prepared open data in a standardised format. Back then open data was in its infancy, and these data were a constantly-changing mess of non-standard Excel spreadsheets.
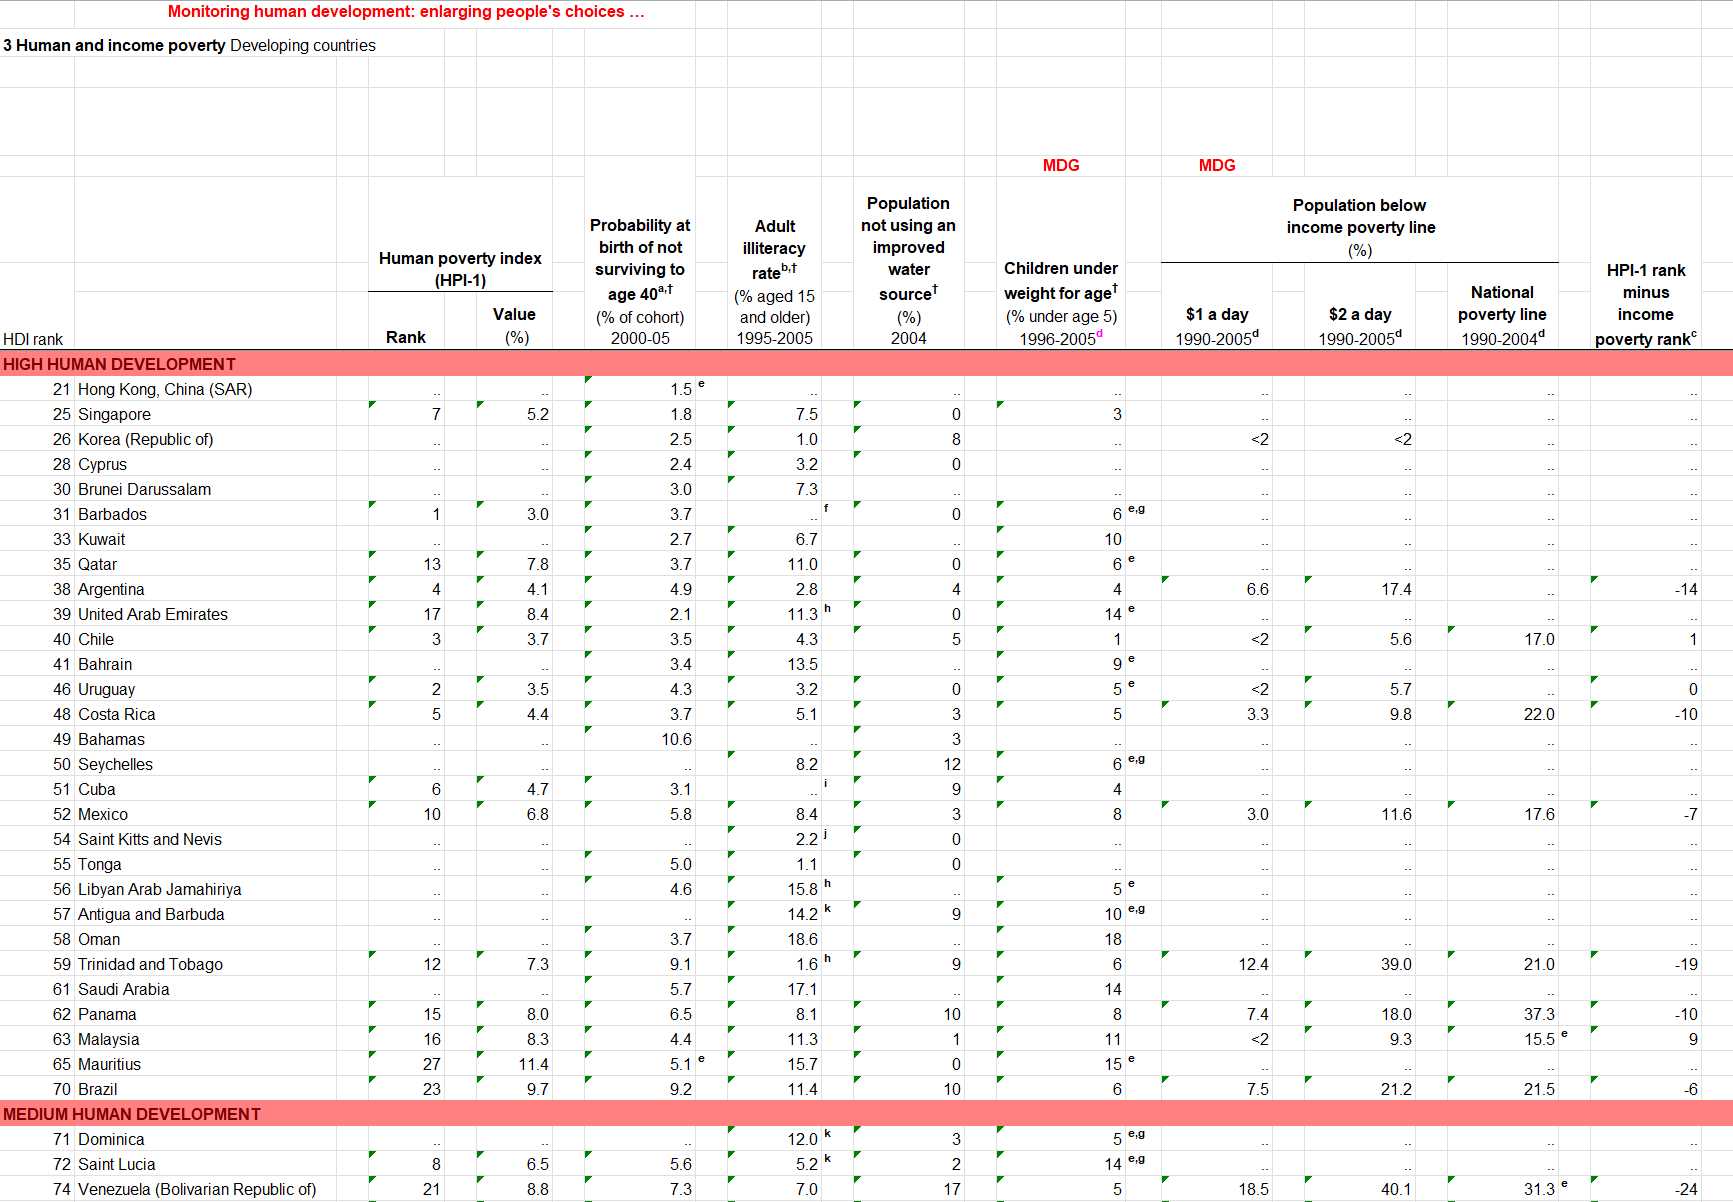
UNDP Human Development Index 2007-2008: a beautiful example of messy data.
If you wanted to do any analysis on these data you first had to set about rebuilding these spreadsheets into a single database aligned to a common schema.
The longer you spend with it, the worse it gets. Teaching data curators in countries around the world the importance of open standards and well-structured machine-readable data is brought home when seeing this and experiencing how difficult it is to work with.
They're a great educational resource, demonstrating that even well-resourced organisations with technically astute staff are capable of travesties of data curation.
Strategy¶
Strategy
H.P. Lovecraft, that old scifi-writing bigot, described Cthulhu as:
"A monster of vaguely anthropoid outline, but with an octopus-like head whose face was a mass of feelers, a
scaly, rubbery-looking body, prodigious claws on hind and fore feet, and long, narrow wings behind."
With a monster that big, you don't fight it all at once.
The majority of tabular data are stored in spreadsheets on people's desktop computers. For most people, Excel is both database and dashboard visualisation software. That also means that source data are designed, foremost, for presentation.
Such data can have any of:
- Merged headers spanning multiple columns and rows
- Random empty rows and columns
- Categorical terms defined as sub-headers as data rows instead of as independent fields
- Joined values containing both quantitative and qualitative data (such as a term and a date)
- Non-numeric data in numeric fields (such as the multiple ways of showing "missing" values)
You'll need to study your source and try and identify all the challenges in your way.
The first and most important strategy we can adopt is to recognise that the source is in the wide format. Sure, it's a mess, but we can split our crosswalk in two:
- Convert our messy data into a structured wide format
- Convert the wide- into a standardised long format
Define a destination schema¶
We want our destination data to conform to the following structure:
| country_name | indicator_name | reference | year | values |
|---|---|---|---|---|
| Hong Kong, China (SAR) | HDI rank | e | 2008 | 21 |
We just not going to get there all in one go. First we'll need to define an interim destination schema in a wide format.
Interim destination wide-format schema¶
When you open our tutorial file as a CSV format ... well ... it's not pretty:
| Unnamed: 0 | Unnamed: 1 | Unnamed: 2 | Monitoring human development: enlarging people's choices … | Unnamed: 4 | Unnamed: 5 | Unnamed: 6 | Unnamed: 7 | Unnamed: 8 | Unnamed: 9 | Unnamed: 10 | Unnamed: 11 | Unnamed: 12 | Unnamed: 13 | Unnamed: 14 | Unnamed: 15 | Unnamed: 16 | Unnamed: 17 | Unnamed: 18 | Unnamed: 19 | Unnamed: 20 | Unnamed: 21 | |
|---|---|---|---|---|---|---|---|---|---|---|---|---|---|---|---|---|---|---|---|---|---|---|
| 0 | 3 Human and income poverty Developing countries | nan | nan | nan | nan | nan | nan | nan | nan | nan | nan | nan | nan | nan | nan | nan | nan | nan | nan | nan | nan | nan |
| 1 | nan | nan | nan | nan | nan | nan | nan | nan | nan | nan | nan | nan | nan | nan | nan | nan | nan | nan | nan | nan | nan | nan |
| 2 | nan | nan | nan | nan | nan | nan | nan | nan | nan | nan | nan | nan | nan | nan | nan | nan | nan | nan | nan | nan | nan | nan |
| 3 | nan | nan | nan | nan | nan | nan | nan | nan | nan | nan | nan | nan | nan | nan | nan | nan | nan | nan | nan | nan | nan | nan |
| 4 | nan | nan | nan | nan | nan | nan | nan | nan | nan | nan | nan | nan | nan | nan | nan | nan | nan | nan | nan | nan | nan | nan |
| 5 | nan | nan | nan | nan | nan | nan | nan | nan | nan | nan | nan | nan | nan | nan | nan | nan | nan | nan | nan | nan | nan | nan |
| 6 | nan | nan | nan | nan | nan | nan | nan | nan | nan | nan | nan | nan | nan | nan | nan | nan | nan | nan | nan | nan | nan | nan |
| 7 | nan | nan | nan | nan | nan | nan | nan | Probability at birth of not surviving to age 40a,† | nan | nan | nan | nan | nan | MDG | nan | MDG | nan | nan | nan | nan | nan | nan |
| (% of cohort) | ||||||||||||||||||||||
| 2000-05 | ||||||||||||||||||||||
| 8 | nan | nan | nan | nan | nan | nan | nan | nan | nan | Adult illiteracy rateb,† | nan | Population not using an improved water source† | nan | Children under weight for age† | nan | Population below | nan | nan | nan | nan | nan | HPI-1 rank minus income poverty rankc |
| (% aged 15 and older) | (%) | (% under age 5) | income poverty line | |||||||||||||||||||
| 1995-2005 | 2004 | 1996-2005d | (%) | |||||||||||||||||||
| 9 | nan | nan | nan | Human poverty index (HPI-1) | nan | nan | nan | nan | nan | nan | nan | nan | nan | nan | nan | nan | nan | nan | nan | nan | nan | nan |
There doesn't seem to be any data. At this stage you may be tempted to start hacking at the file directly and see what you can fix, but our objective is not only clean data, but also an auditable record of how you went from source to final that can demonstrate the decisions you made, and whether you were able to maintain all the source data.
We're going to want to preserve as much as possible, so we're going to define everything as a string type.
Notice that headers define a number of concepts simultaneously:
UNDP Human Development Index 2007-2008: composite header over multiple lines and columns
If you unpack this, you get the following set of column headers:
- Population below income poverty line (%), at $1 a day for the period 1990-2005
- An unlabeled reference column
- Population below income poverty line (%), at $2 a day* for the period 1990-2005
- An unlabeled reference column
- Population below income poverty line (%), at the National poverty line for the period 1990-2004
- An unlabeled reference column
These are spread over multiple merged columns and rows. We can think about this as requiring two steps:
- We first need to get all the columns lined up with a proper header row
- We then split the header definitions into a
yearandindicator_namefield.
We start by defining an interim schema:
datasource = qd.DataSourceDefinition()
datasource.derive_model(source=SOURCE_DATA, mimetype=MIMETYPE, header=None)
schema_source = qd.SchemaDefinition()
schema_source.derive_model(data=datasource.get)
We explicitly tell whyqd we don't want to use any header row from the data: header=None. Instead you'll simply
get a column-indexed set of terms: column_0, column_1, etc. Look at your data, count across, and write scripts.
We can aim for the following set of columns. You'll see we created composite header names joined by ;;, which we can
split later. We also identified category terms used as headers inside the data, and these will be pivoted into a new
HDI Category column.
We also derived a source schema which we'll refer to as SCHEMA_SOURCE and also our DATASOURCE.
NEW_COLUMNS = [
    "HDI rank",
    "Country",
    "Human poverty index (HPI-1) - Rank;;2008",
    "Reference 1",
    "Human poverty index (HPI-1) - Value (%);;2008",
    "Probability at birth of not surviving to age 40 (% of cohort);;2000-05",
    "Reference 2",
    "Adult illiteracy rate (% aged 15 and older);;1995-2005",
    "Reference 3",
    "Population not using an improved water source (%);;2004",
    "Reference 4",
    "Children under weight for age (% under age 5);;1996-2005",
    "Reference 5",
    "Population below income poverty line (%) - $1 a day;;1990-2005",
    "Reference 6",
    "Population below income poverty line (%) - $2 a day;;1990-2005",
    "Reference 7",
    "Population below income poverty line (%) - National poverty line;;1990-2004",
    "Reference 8",
    "HPI-1 rank minus income poverty rank;;2008",
    "HDI Category",
]
Now we define our interim destination schema:
schema: qd.models.SchemaModel = {
    "name": "human-development-report-interim",
    "title": "UN Human Development Report 2007 - 2008",
    "description": """
        In 1990 the first Human Development Report introduced a new approach for
        advancing human wellbeing. Human development – or the human development approach - is about
        expanding the richness of human life, rather than simply the richness of the economy in which
        human beings live. It is an approach that is focused on people and their opportunities and choices.""",
}
fields: list[qd.models.FieldModel] = [{"name": c, "type": "string"} for c in NEW_COLUMNS]
schema_interim = qd.SchemaDefinition()
schema_interim.set(schema=schema)
schema_interim.fields.add_multi(terms=fields)
We'll call this definition as SCHEMA_INTERIM below.
Final destination long-format schema¶
While there will be some slight restructuring, our destination is easy to define. Note the subtle name change in the
schema definition:
schema: qd.models.SchemaModel = {
    "name": "human-development-report",
    "title": "UN Human Development Report 2007 - 2008",
    "description": """
        In 1990 the first Human Development Report introduced a new approach for
        advancing human wellbeing. Human development – or the human development approach - is about
        expanding the richness of human life, rather than simply the richness of the economy in which
        human beings live. It is an approach that is focused on people and their opportunities and choices.""",
}
fields: list[qd.models.FieldModel] = [
    {
        "name": "year",
        "title": "Year",
        "type": "string",
        "description": "Year of release.",
    },
    {
        "name": "country_name",
        "title": "Country Name",
        "type": "string",
        "description": "Official country names.",
        "constraints": {"required": True},
    },
    {
        "name": "indicator_name",
        "title": "Indicator Name",
        "type": "string",
        "description": "Indicator described in the data series.",
    },
    {
        "name": "values",
        "title": "Values",
        "type": "number",
        "description": "Value for the Year and Indicator Name.",
        "constraints": {"required": True},
    },
    {
        "name": "reference",
        "title": "Reference",
        "type": "string",
        "description": "Reference to data source.",
    },
]
schema_destination = qd.SchemaDefinition()
schema_destination.set(schema=schema)
schema_destination.fields.add_multi(terms=fields)
We'll call this definition as SCHEMA_DESTINATION below.
Defining crosswalks and transforms¶
We're going to do this in one, splitting out the interim steps.
Interim crosswalk and transform¶
Here's a list of the various things we need to fix in this first step:
- Replace the
nanheaders with a proper text header row, - Convert the row-level categories (at rows 15, 45 and 121) into actual categories,
- Remove unnecessary rows towards the bottom of the table (from 144 onwards),
- Rename the default generated columns to the interim schema.
The information we're deleting from the bottom is also not irrelevent. They're the references that the abbreviated terms
in reference refer to (e is a reference to the footnotes). However, we can extract these footnotes in a separate
process.
crosswalk_interim = qd.CrosswalkDefinition()
crosswalk_interim.set(schema_source=SCHEMA_SOURCE, schema_destination=SCHEMA_INTERIM)
# Create the crosswalk
schema_scripts = [
    f"DELETE_ROWS < {list(range(15)) + list(np.arange(144, SCHEMA_SOURCE.get.index))}",
    "PIVOT_CATEGORIES > 'HDI Category' < 'column_0'::[15, 45, 121]",
]
indices = [0, 1, 3, 4, 5, 7, 8, 9, 10, 11, 12, 13, 14, 15, 16, 17, 18, 19, 20, 21]
for i, j in enumerate(indices):
    source_field = SCHEMA_SOURCE.fields.get_all()[j]
    interim_field = SCHEMA_INTERIM.fields.get_all()[i]
    schema_scripts.append(f"RENAME > '{interim_field.name}' < ['{source_field.name}']")
crosswalk_interim.actions.add_multi(terms=schema_scripts)
We're using DELETE_ROWS to delete two ranges, from the top and bottom.
PIVOT_CATEGORIES requires a bit of thinking. We have categorical headers at indexed rows 15, 45 and 121. There's no
other information in these rows, and these headings categorise all the data in the following rows. We're going to pivot
these categories into their own field, HDI Category.
All of that captured in the following script: "PIVOT_CATEGORIES > 'HDI Category' < 'column_0'::[15, 45, 121]"
Next is just a bity of Python optimisation for the RENAME step. Some of the source data columns are empty and we will
discard them. All remaining fields in the schema - except for HDI Category - can be processed by aligning the indices
and adding them as part of the crosswalk actions.
We can implement the transform and see what we got:
transform_interim = qd.TransformDefinition(crosswalk=CROSSWALK_INTERIM, data_source=DATASOURCE.get)
transform_interim.process()
transform_interim.save(directory=DIRECTORY)
We save it since we'll need the interim data as an import.
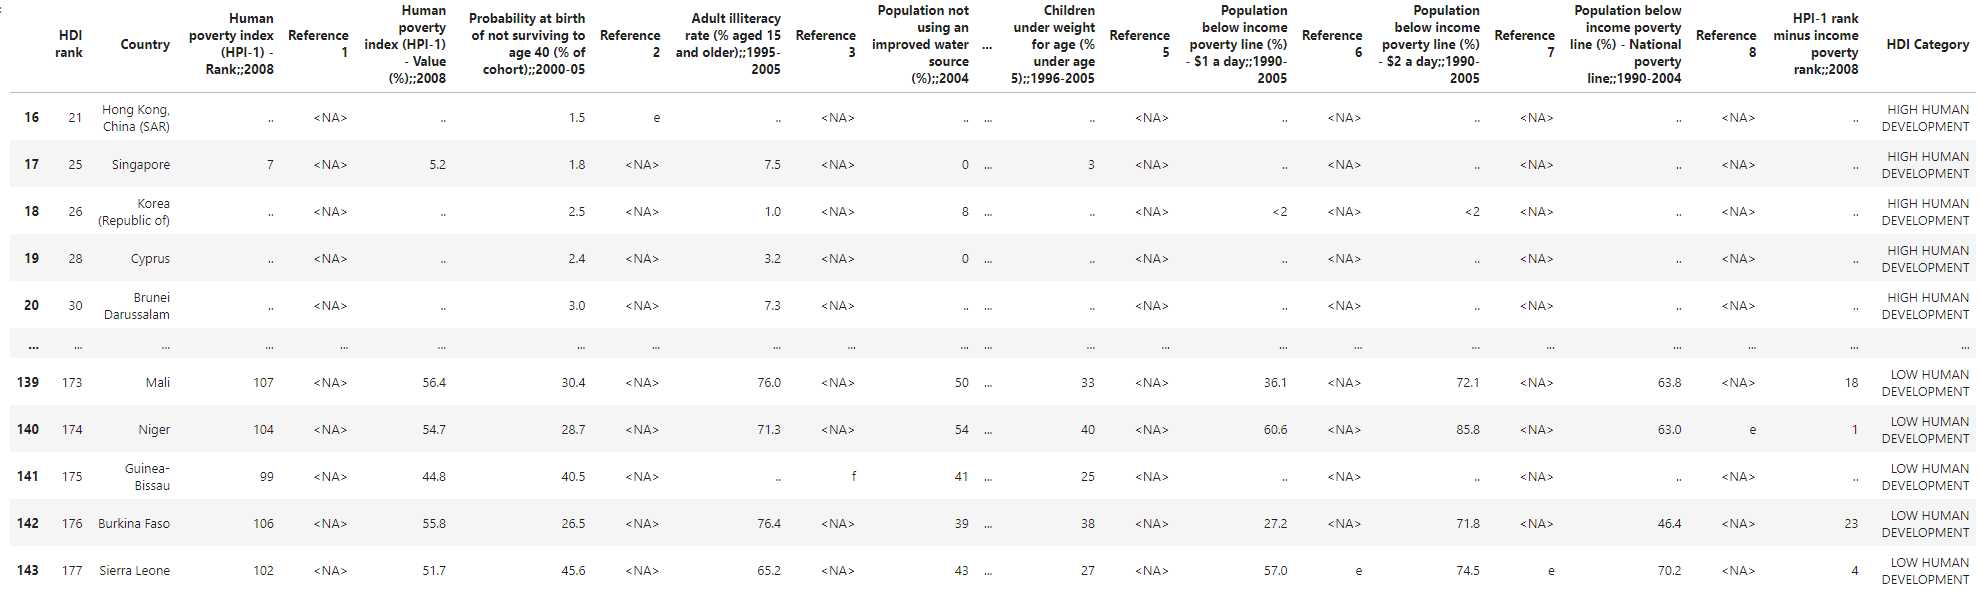
UNDP Human Development Index 2007-2008: interim crosswalked data outpu
Looks a lot better. And you can see how nicely lined-up HDI Category data.
Destination crosswalk and transform¶
This leaves the following to be done in the destination crosswalk:
- Pivot the header row indicator terms to create a new 'indicator_name' column,
- Split the 'indicator_name' column to separate the 'year' into its own column,
- Join all the separate 'Reference' columns into a single column.
SCHEMA_INTERIM.get.index = transform.get.dataDestination.index
crosswalk_destination = qd.CrosswalkDefinition()
crosswalk_destination.set(schema_source=SCHEMA_INTERIM, schema_destination=SCHEMA_DESTINATION)
# Create the crosswalk
reference_columns = [c.name for c in SCHEMA_INTERIM.fields.get_all() if c.name.startswith("Reference")]
schema_scripts = [
    f"UNITE > 'reference' < {reference_columns}",
    "RENAME > 'country_name' < ['Country']",
    "PIVOT_LONGER > ['indicator_name', 'values'] < ['HDI rank', 'HDI Category', 'Human poverty index (HPI-1) - Rank;;2008', 'Human poverty index (HPI-1) - Value (%);;2008', 'Probability at birth of not surviving to age 40 (% of cohort);;2000-05', 'Adult illiteracy rate (% aged 15 and older);;1995-2005', 'Population not using an improved water source (%);;2004', 'Children under weight for age (% under age 5);;1996-2005', 'Population below income poverty line (%) - $1 a day;;1990-2005', 'Population below income poverty line (%) - $2 a day;;1990-2005', 'Population below income poverty line (%) - National poverty line;;1990-2004', 'HPI-1 rank minus income poverty rank;;2008']",
    "SEPARATE > ['indicator_name', 'year'] < ';;'::['indicator_name']",
    "DEBLANK",
    "DEDUPE",
]
crosswalk_destination.actions.add_multi(terms=schema_scripts)
UNITE will join all the string terms in the reference_columns into the reference field. By default, this is
comma-separated: e, f, g.
PIVOT_LONGER you've seen before in the second tutorial, but simply pivots all the wide-format
headers into an indicator_name term, and their corresponding values.
But ... we set up a clever twist for ourselves. Some of the new indicator_name terms can be split to extract the year
terms. We use SEPARATE, splitting the text on ;;. Where terms have no ;;, the year column will remain null.
Finally, one last thing to observe ... SCHEMA_INTERIM.get.index = transform.get.dataDestination.index
The interim schema doesn't have an index count, but we're doing a lot of physical transformation, so we need to explicitly pass this index from the transform to ensure that the destination transform remains within bounds.
transform = qd.TransformDefinition(crosswalk=crosswalk, data_source=transform_interim.get.dataDestination)
transform.process()
transform.save(directory=DIRECTORY)
And our output:
| country_name | indicator_name | reference | year | values |
|---|---|---|---|---|
| Hong Kong, China (SAR) | HDI rank | e | 2008 | 21 |
| Singapore | HDI rank | nan | 2008 | 25 |
| Korea (Republic of) | HDI rank | nan | 2008 | 26 |
| Cyprus | HDI rank | nan | 2008 | 28 |
| Brunei Darussalam | HDI rank | nan | 2008 | 30 |
Extending the tutorial¶
I encourage you to explore this dataset and see if you agree with the decisions made. And, hopefully, as far as Cthulhu datasets are concerned, the deep holds a smidgeon fewer fears.