Tutorial 2: Pivoting wide-format data into archival long-format
whyqd (/wɪkɪd/) helps with what is a frequent tension in data communication. The way we archive data is different from the way people need to see or use it.
Learning outcomes
- Develop a sense of the difference between archival and presentation data
- Demonstrate how to define a schema
- Perform pivot-based crosswalks and generate a schema-compliant output
SOURCE_DATA are from World Bank urban population time-series
and it is assumed you have familiarity with Python and Pydantic.
SOURCE_DATA = "https://github.com/whythawk/whyqd/blob/d95b9a8dc917ed119f0b64cb2a3f699e4fee7a8d/tests/data/working_test_world_bank_data.xlsx"
MIMETYPE = "xlsx"
Strategy
Strategy
Curation is about recognising contextual requirements. Updating rows in a database is far easier than adding in new columns / fields. Yet people find it easier to "read" data like text (so in the direction of travel - right-to-left or left-to-right, depending on language).
This often means you need to pivot data from wide- to long- formats, and vice versa.
One of the most obvious uses for wide-format data is for visualisation. Libraries like D3.js expect data-series in lists. The World Bank has gotten into the habit of making their open data for their time-series data wide. Which is fine, but every year it gets wider.
For archival, that's a problem. Instead of adding a few new rows, you would need to update your entire database; first add in a new year / value field, and then updating every row with data for the new field. That's frought with risk for destructive change to source data.
Instead we will simply clean up and pivot the source data.
There is an additional problem. Country names.
Strategy
There is an almost perverse number of ways of spelling country names.
Take Côte d'Ivoire, which can be spelled as Côte d'Ivoire, Cote d'Ivoire, Republic of Côte d'Ivoire, or - if people are feeling extra churlish - Ivory Coast.
And countries can decide to change their names too. Turkey is now known as Türkiye.
Good practice is to treat country names as categorical data so that you can rematch as required without needing an additional post-transformation step.
We won't be doing that here, merely to keep the tutorial shorter (you can review the first tutorial
for guidance on categorical data assignment). We have a country_code field which does keep things ordered, so the
country_name field is mostly a human-aid.
Keep it in mind, though. Consistent naming is a perpetual challenge.
Define a destination schema
We want our destination data to conform to the following structure:
| indicator_code | indicator_name | country_code | country_name | year | values |
|---|---|---|---|---|---|
| SP.URB.TOTL | Urban population | ABW | Aruba | 1960 | 27526 |
| SP.URB.TOTL | Urban population | AFG | Afghanistan | 1960 | 755836 |
| SP.URB.TOTL | Urban population | AGO | Angola | 1960 | 569222 |
| SP.URB.TOTL | Urban population | ALB | Albania | 1960 | 493982 |
Review the schema documentation for more details, but these are the type of data we need:
string: any text-based string.number: any number-based value, including integers and floats.year: Any year, formatted asYYYY.
In addition, these data can be constrained:
required: boolean, indicates whether this field is compulsory.
Let's start:
import whyqd as qd

schema_destination = qd.SchemaDefinition()
# Using Pydantic model validation
schema: qd.models.SchemaModel = {
    "name": "urban_population",
    "title": "Urban population",
    "description": "Urban population refers to people living in urban areas as defined by national statistical offices. It is calculated using World Bank population estimates and urban ratios from the United Nations World Urbanization Prospects. Aggregation of urban and rural population may not add up to total population because of different country coverages.",
}
schema_destination.set(schema=schema)
We'll build a single fields dictionary and then iterate over the list to add each field:
fields: list[qd.models.FieldModel] = [
    {
        "name": "indicator_code",
        "title": "Indicator Code",
        "type": "string",
        "description": "World Bank code reference for Indicator Name.",
        "constraints": {"required": True},
    },
    {
        "name": "country_name",
        "title": "Country Name",
        "type": "string",
        "description": "Official country names.",
        "constraints": {"required": True},
    },
    {
        "name": "country_code",
        "title": "Country Code",
        "type": "string",
        "description": "UN ISO 3-letter country code.",
        "constraints": {"required": True},
    },
    {
        "name": "indicator_name",
        "title": "Indicator Name",
        "type": "string",
        "description": "Indicator described in the data series.",
        "constraints": {"required": True},
    },
    {
        "name": "year",
        "title": "Year",
        "type": "year",
        "description": "Year of release.",
        "constraints": {"required": True},
    },
    {
        "name": "values",
        "title": "Values",
        "type": "number",
        "description": "Value for the Year and Indicator Name.",
        "constraints": {"required": True},
    },
]
schema_destination.fields.add_multi(terms=fields)
This is our curation foundation and we can save it, ensuring citation and version control.
schema_destination.save(directory=DIRECTORY, filename=FILENAME, created_by=CREATOR)
We'll reference this definition as SCHEMA_DESTINATION in the rest of the tutorial.
Source data and source schema definitions
There's a set of challenges when you review the source data:
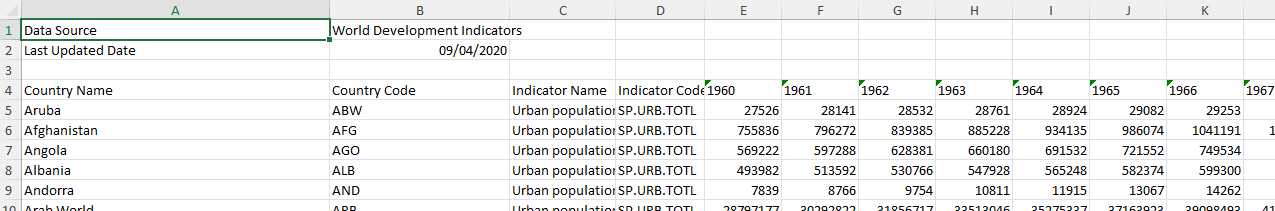
The header row doesn't start at index 0. It starts at index 3. Oh, and there are multiple tabs with additional
contextual metadata on each. We won't use that in this tutorial, but it's not irrelevant.
Reviewing this allows us to derive our source schema as follows:
datasource = qd.DataSourceDefinition()
# There are three sheets:
# - Data, index 3
# - Metadata - Countries
# - Metadata - Indicators
# We're only going to use the first
datasource.derive_model(source=SOURCE_DATA, mimetype=MIMETYPE, header=[3, 0, 0])
schema_source = qd.SchemaDefinition()
schema_source.derive_model(data=datasource.get[0])
Strategy
You will have spotted header=[3, 0, 0] defining where the header row can be found. You could even use None if
there is no header row at all and the data start at 0.
This isn't some way to skip a crosswalk step. whyqd aims for two key affordances:
- Explicit rather than implicit - the software won't automagically derive things without your say-so. It will only do what you tell it to do.
- Consistency and predictability - it will always do things the same way each time.
You will need to remove those unnecessary rows in your crosswalk.
Defining crosswalks
Except for that iffy requirement of removing those redundant rows above the header (and that header itself), the crosswalk is straightforward.
crosswalk = qd.CrosswalkDefinition()
crosswalk.set(schema_source=schema_source, schema_destination=schema_destination)
# Create the crosswalk
schema_scripts = [
    "DEBLANK",
    "DEDUPE",
    "DELETE_ROWS < [0, 1, 2, 3]",
    f"PIVOT_LONGER > ['year', 'values'] < {datasource.get[0].names[4:]}",
    "RENAME > 'indicator_code' < ['Indicator Code']",
    "RENAME > 'indicator_name' < ['Indicator Name']",
    "RENAME > 'country_code' < ['Country Code']",
    "RENAME > 'country_name' < ['Country Name']",
]
crosswalk.actions.add_multi(terms=schema_scripts)
DEBLANK and DEDUPE are useful housekeeping actions, removing all blank rows and columns, and then removing any
completely duplicated rows.
The only potentially challenging action is the pivot:
f"PIVOT_LONGER > ['year', 'values'] < {datasource.get[0].names[4:]}"
Firstly, the data source model has a names field which is only populated when the header row is to be replaced (i.e.
we're not using whatever is at index 0 as the header). This is just a list of text terms.
We already know the data structure, where the first four columns are 'Country Name', 'Country Code', 'Indicator Name',
and 'Indicator Code'. Everything that follows - datasource.get[0].names[4:] - is a year field with values in the
rows beneath.
PIVOT_LONGER transforms each field in the source into terms in two new fields. The first is for the name of the
original field, and the second is for the values beneath it.
Transformations with crosswalks
We can now assign a crosswalk and produce our transformation:
transform = qd.TransformDefinition(crosswalk=crosswalk, data_source=datasource.get[0])
transform.process()
transform.save(directory=DIRECTORY)
You can validate your transform as well:
DESTINATION_DATA = DIRECTORY / transform.model.dataDestination.name
DESTINATION_MIMETYPE = "parquet"
TRANSFORM = DIRECTORY / f"{transform.model.name}.transform"
valiform = qd.TransformDefinition()
valiform.validate(
    transform=TRANSFORM, data_destination=DESTINATION_DATA, mimetype_destination=DESTINATION_MIMETYPE
)
And your data are ready for archival.
Extending the tutorial
In the Strategy section, best practice indicates we should derive the country names as categorical terms so that we can support future country-naming variations or changes.
This is left to you as an exercise.