Strategies for data curation and management
Definition
Data curation includes all the processes and techniques needed for ethical and reproducable data creation, management, transformation, and presentation for reuse.
The role of a data scientist is to support a research team in producing an answer to a research question that is robust, stands up to scrutiny, and is supported by ethical measurement data acquired during a study process.
Ensuring we know what we know would seem to be the simplest of our data curation responsibilities.
whyqd (/wɪkɪd/) is a curatorial toolkit intended to produce well-structured and predictable data for research analysis.
Further learning
I have written two Jupyter Notebook-based courses which go far deeper into data curation and data science:
- Data Wrangling and Validation is an introductory course and starts with a basic introduction to Python. It assumes zero knowledge.
- Data as a Science consists of four modules of a data science Masters degree course (out of what will eventually be 20). It teaches data science through peer review of clinical trials and the development of synthetic data.
Data transformation strategies for whyqd
Strategy
Transformations are performed on schemas, not source data.
Explicit is better than implicit. Don't leave transformation steps out.
The objective of whyqd is not to explore data, or perform interim analysis, but to support schema-based workflows and validations, and documented and auditable transformations.
Your approach can follow variations on schema-to-schema or data-to-schema-to-schema strategies.
Schema-to-Schema
This can be thought of as a relatively abstract approach since source data are not involved until the final application step.
- Define, or import, a source schema with fields that describe and constrain columns in source data,
- Define, or import, a destination schema,
- Specify a crosswalk to perform a schema-to-schema transformation,
- Validate the transformation crosswalk,
- Save the crosswalk for future or automated / programmatic use,
- Apply this to source data.
Data-to-Schema-to-Schema
Here you derive a schema from source data and go from there. There is a temptation to explore the data, but that risks biased or destructive data strategies. Focus on definitions and transformation.
- Import a source data file,
- Apply an existing schema and test whether the source conforms to that schema,
- Alternatively, derive a minimal transformable schema from the data source,
- Specify a crosswalk to perform a schema-to-schema transformation,
- Alternatively, specify a destination schema, and define a crosswalk to transform the source to destination schema,
- Validate the transformation crosswalk,
- Apply this to the source data.
Transformations and the Minimum Transformable Schema
No matter your approach, the transformation crosswalk can be saved and applied to multiple sources which conform to the crosswalk. That requires any source data to be defined by a schema, and transformations applied to that schema.
Ultimately, data are transformed, but the objective is that any data meeting a particular schema definition can be restructured using a schema transform.
A minimum transformable schema has the following properties:
- For every column in the data source, there is a matching field in the schema. Each column is either defined in the data's header row, or as a separate, ordered list of header names in the schema which match the listed fields.
- A
stringis a legitimate default field type and can be converted during a transformation process. - If categorical terms are to form part of a transformation, then these categorical terms must be defined up-front as part of the schema, and not as part of a transformation. Once data are transformed - as part of analysis - you can introduce new categorisations or aggregations.
That means that no matter how brutally ugly source data may be, they can be reduced to a defined schema and transformed from there.
Classification and metadata
The creator of a dataset would best know what their data are about and should assign keywords as descriptors. These data about data are called metadata. The term is ambiguous, as it is used for two fundamentally different concepts, both of which are defined and documented in whyqd models:
- Structural metadata correspond to internal metadata (i.e. metadata about the structure, or fields, of database objects such as tables, columns, keys and indexes),
- Descriptive metadata correspond to external metadata. (i.e. metadata typically used for discovery and identification, as information used to search and locate an object such as title, author, subject, keywords, publisher).
Each of these help with understanding the aboutness of what is otherwise a nebulous table of obscure values.
Descriptive metadata permits discovery of the object. Structural metadata permits the data to be applied, interpreted, analysed, restructured, and joined to other, similar, datasets. Metadata can permit interoperability between different systems. An agreed-upon structure for querying the aboutness of a data series can permit unrelated software systems to find and use remote data.
Beyond metadata, there are also mechanisms for the structuring of relationships between hierarchies of keywords. These are known as ontologies and, along with metadata, can be used to accurately define and permit discovery of data.
Adding metadata to existing data resources can be a labour-intensive and expensive process. This may become a barrier to implementing a comprehensive data management system.
This presents the greatest risk for data consistency. Any format change or manipulation, or even copying a file from one system to another, introduces the potential for data corruption. Similarly, it also increases the potential for data - whether erroneous or not - to be accidentally released to users or the public before it is ready.
whyqd supports data curation through providing an intuitive method for deriving and creating data schemas as a JSON Schema-compliant file. It further supports schema-to-schema transformations using an expressive action scripting language.
Data resolution, ethics and interoperability
Ethics
The best way to reduce ethical risks during a study is not to collect unnecessary subject-specific data. If you don't need it to answer a research question, don't collect it in the first place.
The NIH Clinical Centre lists seven principles for guiding the conduct of ethical research. All of these are important, but some aspects of this methodology have implications for data reuse and interoperability.
Singapore's Personal Data Protection Commission describe the following disclosure risks:
- Identity disclosure (re-identification): permitting the identity of an individual described by a specific record. This could arise from scenarios such as insufficient anonymisation, re-identification by linking, or pseudonym reversal.
- Attribute disclosure: determining that an attribute described in the dataset belongs to a specific individual, even if the individual’s record cannot be distinguished.
- Inference disclosure: making an inference about an individual even if they are not in the dataset, by statistical properties of the dataset.
The risk is not only from one dataset, but from the way in which multiple datasets can be recombined.
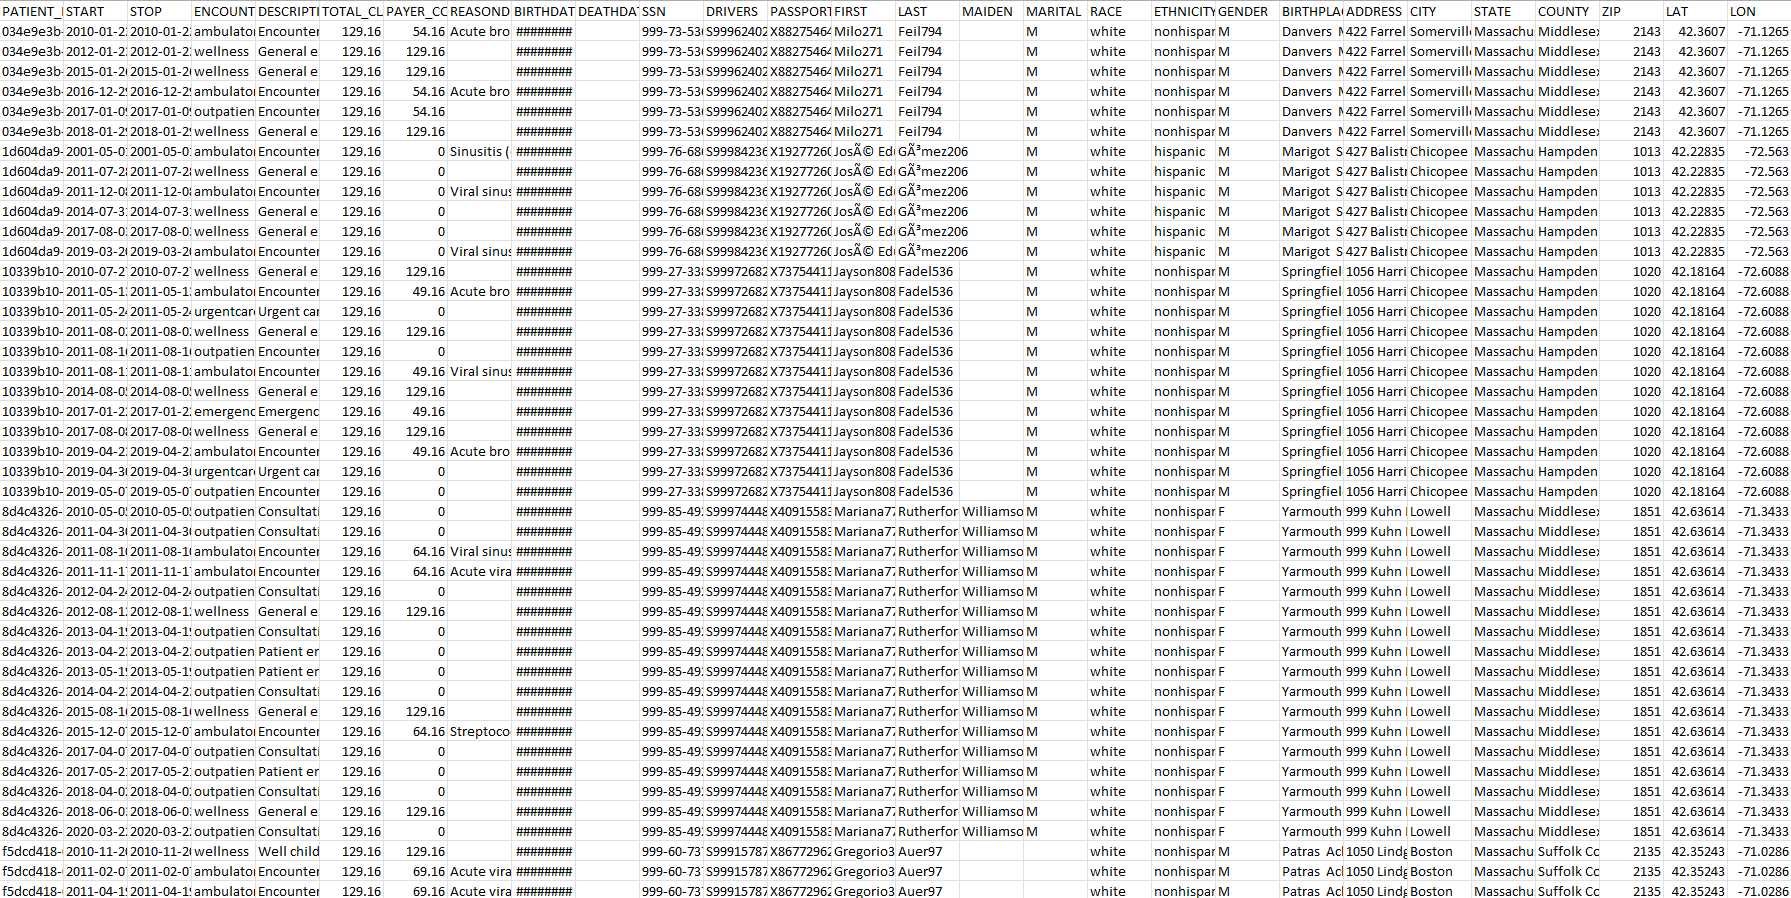
A typical example of such a risk is in the release of medical history. e.g. a dataset containing anonymised patient records of a surgeon reveals that all his patients below the age of 30 have undergone a particular procedure. If it is known that a specific individual is 28 years old and is a client of this surgeon, we then know that this individual has undergone the particular procedure, even if the individual's record cannot be distinguished from others in the anonymised dataset.
Instead of collecting patient data at the resolution of birth date, the study may choose to redact these data through collation by categorical age:
["20-40", "40-60", "60-80"]
That resolves the issue and ensures that patients are at far less risk to deanonymisation, even where data are published. However, say you wish to reuse their data, but at greater resolution:
["20-30", "30-40", "40-50", "50-60", "60-70", "70-80"]
There is no date of birth, and no means of allocating individuals to these categories, so transformation is not possible. You would need to adjust your study protocol accordingly.
Ethics
Schema transformations are not a cavalier solution to source data requirements. A study protocol must take cognisance of source resolution and adjust study protocols, and study data schemas, to ensure accord.
Defining schema properties with standards
JSON Schema is a suite of tools and definitions for defining and validating structural metadata. It is not intrinsically designed to support data interoperability, but it is a useful set of definitions - with a growing community of resources - for information curation.
Let's look at a simple schema according to JSON Schema's tutorial:
{
  "$schema": "https://json-schema.org/draft/2020-12/schema",
  "title": "Product",
  "description": "A product from Acme's catalog",
  "type": "object",
  "properties": {
    "productId": {
      "description": "The unique identifier for a product",
      "type": "integer"
    }
  },
  "required": [ "productId" ]
}
$schemaindicates that this schema is written according to a specific draft of the standard and used for a variety of reasons, primarily version control.$iddefines a URI for the schema, and the base URI that other URI references within the schema are resolved against.titleanddescriptionare descriptive annotation keywords. They do not add constraints to the data being validated. The intent of the schema is stated with these two keywords.typevalidation keyword the first constraint on our JSON data and in this case it has to be a JSON Object.propertiesvalidation keyword. This contains a set of objects each defining a property within the schema:productIdkey.descriptionschema annotation andtypevalidation keyword.
- The
requiredvalidation keyword listingproductId.
This is useful for reflecting a set of products for sale on a website, but not as concise or helpful for actual tabular data. whyqd uses a variation of JSON Schema, called Table Schema:
{
  // fields is an ordered list of field descriptors
  // one for each field (column) in the table
  "fields": [
    // a field-descriptor
    {
      "name": "name of field (e.g. column name)",
      "title": "A nicer human readable label or title for the field",
      "type": "A string specifying the type",
      "format": "A string specifying a format",
      "example": "An example value for the field",
      "description": "A description for the field"
      // ...
    },
    // ... more field descriptors
  ],
  // (optional) specification of missing values
  "missingValues": [ ... ],
  // (optional) specification of the primary key
  "primaryKey": ...
  // (optional) specification of the foreign keys
  "foreignKeys": ...
}
whyqd's schema definitions show you how to create, or derive, a schema to reflect source data.
Auditable data transformation
Whyqd.com supports trust in research by ensuring complete and unambiguous probity in the curation of all source data.
Data probity refers to the following criteria:
- Identifiable input source data,
- Transparent methods for restructuring of that source data into the data used to support research analysis,
- Accessible restructured data used to support research conclusions,
- A repeatable, auditable curation process which produces the same data.
Researchers may disagree on conclusions derived from analytical results. What they should not have cause for disagreement on is the probity of the underlying data used to produce those analytical results.
The strategy guides for schemas, data sources, and crosswalks cover the process for transforming source data to conform to a base schema, crosswalks, and transformation and validation.
Data structure and machine-readable standards
There are a number of common formats for data distribution. Some of these are considered "open" (such as CSV, XML, text and others) and some proprietary (SAS, STATA, SPSS, etc.). XLS and XLSX, associated with Microsoft Excel, are relatively open formats and a number of software systems can interpret the data.
Proprietary formats are legitimate for research publication since these are the software systems used by many professional data users. However, since these formats are often not interoperable, the potential for data re-use is limited unless open formats are also supported. Data dissemination in proprietary formats does not preclude dissemination in open formats and vice versa.
Spreadsheets and distributed data systems often lack an agreed data structure. A researcher who wishes to combine this with other data first needs to normalise it and then decide on standardised terms to define the columns and data-types in those columns.
Converting semi-structured tabular data into a typical machine-readable format results in the comma-separated-value (CSV) file. These are tabular files with a header row which defines each of the data in the columns and rows below.
Ignoring any further standards compliance, CSV files can be so arranged that they are "joined" on a common column. For example, a set of geospatial coordinates can be used to connect a number of similar files covering different data series.
Requirements for machine-readable tabular data
Data.gov has a useful Primer on Machine Readability for Online Documents and Data and a comment thread at Data.gov.uk offers the following guidance:
- A user can open the data file in freely-available and widely accessible software packages - this means that formats such as CSV should be preferred over, or offered in addition to formats like Excel, and proprietary formats which can only be opened with commercial or specialist software should be avoided.
- It is possible to process the data directly, carrying out any appropriate operations on it such as sorting columns, filtering rows, running aggregates of values - this requires well structured data. Where possible, the meaning of the data should not be contained in the layout.
- Common elements in the dataset are expressed in uniform ways - for example, dates are always in the same format, codes or names are always in the same case, and numbers are expressed consistently (e.g. 1,000 or 1000 but not a mixture of the two).
- The meaning of fields and values is clearly documented - either through clear naming of fields, or through accompanying descriptions provided along with the data.
- Machine readability is enhanced if the dataset uses common standards where they exist - including standard identifiers and standard field names. These might be standards like the public spending vocabulary developed for government, or third-party standards such as KML for indicating 'points of interest'.
Long vs wide data formats for archival and presentation
Any data series consists of numerical values (usually) described by standardised metadata terms (time, area, a specific description, etc). There are two main ways of presenting these machine-readable data, which can be summarised as wide or long. You need to make a deliberate choice as to which format you will choose, and each has its own particular strengths and weaknesses:
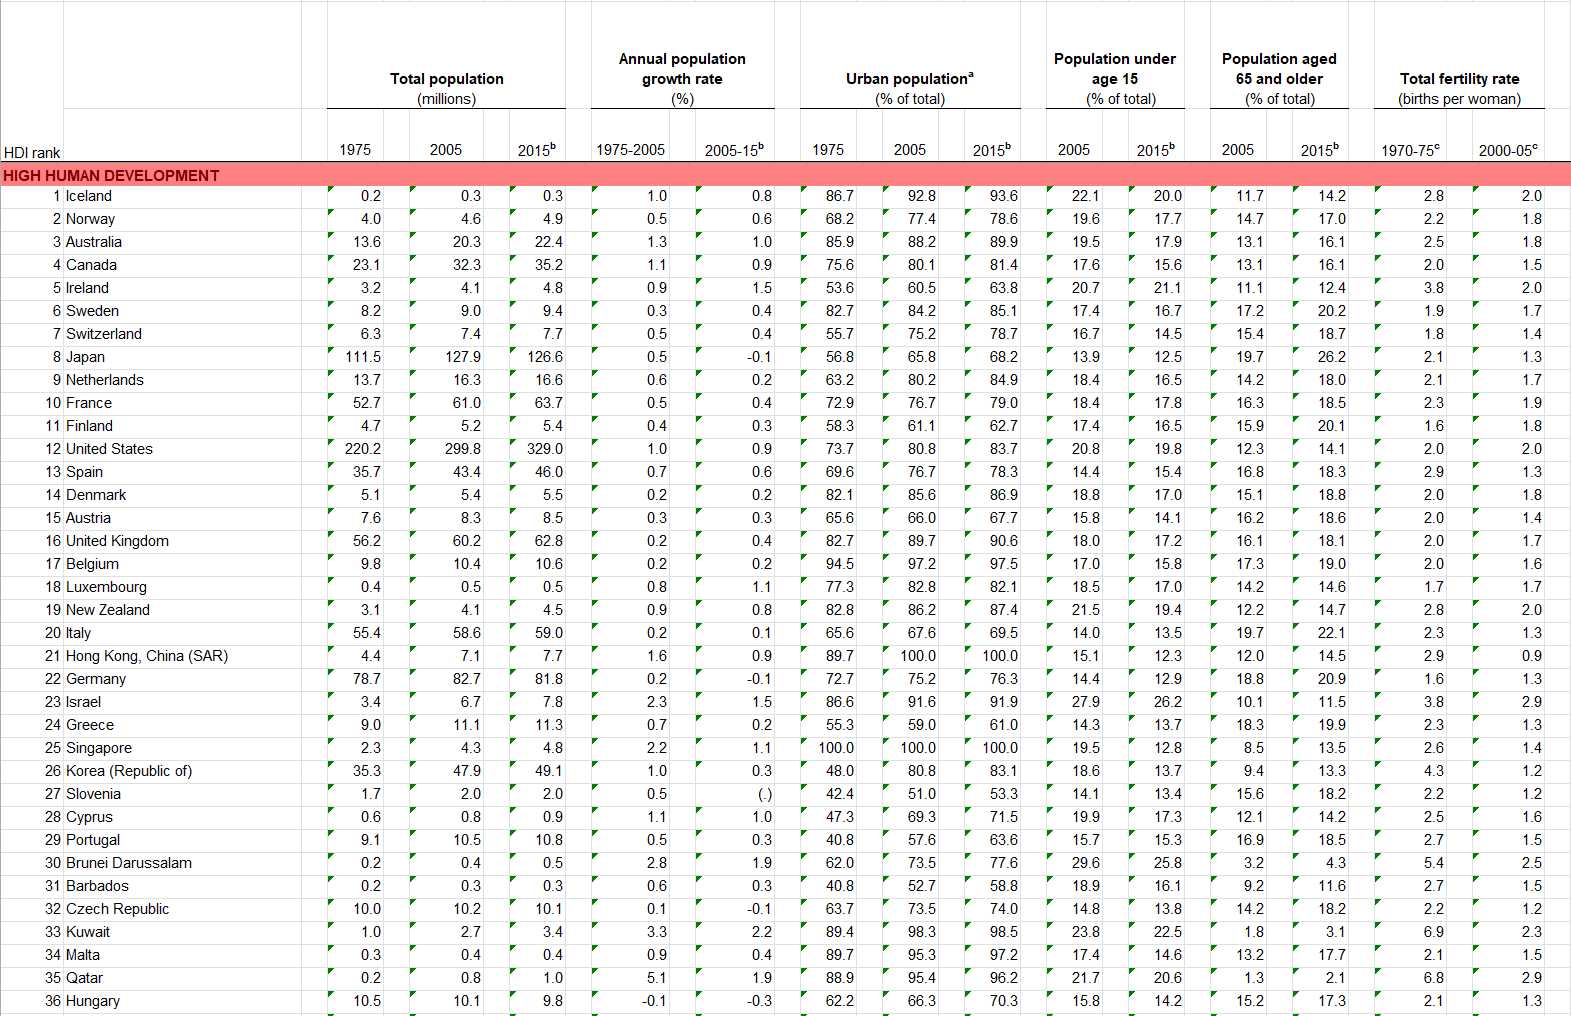
Wide data
Wide data present numerical data in multiple columns. Either as categories (e.g. each country is presented in its own column) or by date (e.g. each annual update results in a new column). New data go across the screen from left to right:
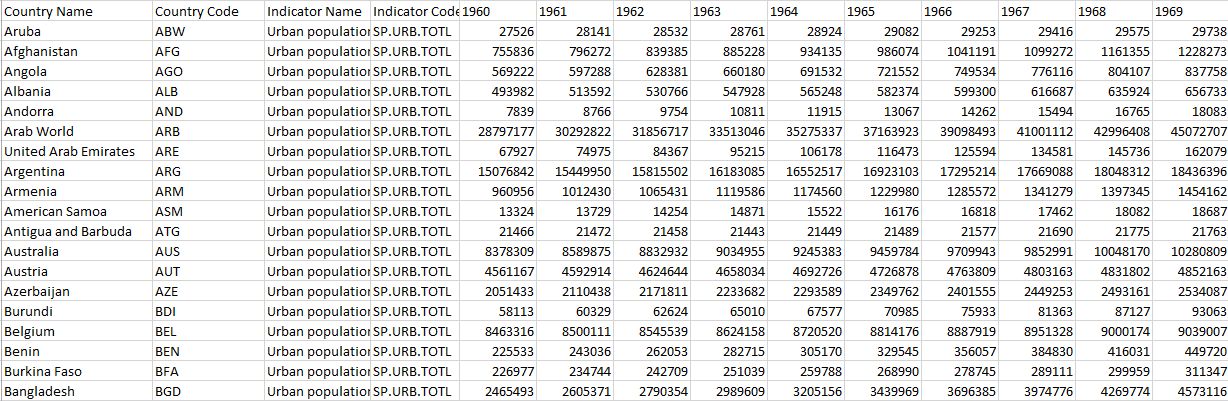
Wide data are often used for data visualisation and processing since the data can easily be grouped into the necessary axes for chart libraries. However, it's a difficult archival format since updating such a dataseries requires the equivalent of creating a new field (the year in the fields above) and then updating every row with appropriate information. That can be an expensive operation in a large database, and also means that writing a programmatic method for querying your data is more challenging.
Long data
Long data present numerical data in multiple rows with only one column for values. New data go down the screen from top to bottom:
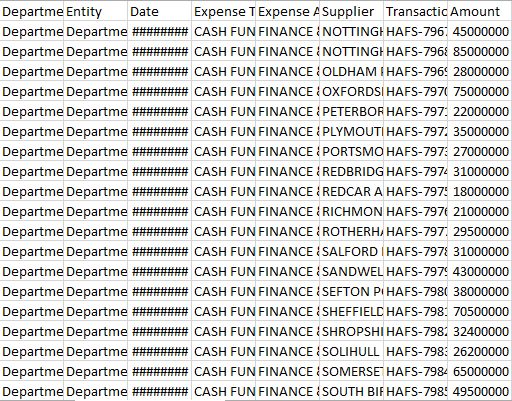
Long data are best for archival and for representing the structure you will ordinarily find in a database. Each row in a long dataseries represents a row in a database. Adding new information is relatively straightforward since you only need update a single row at a time. In database terms, you'd be creating a single database entry.
The preference is for the long format, and this will be the method usually recommended for release. That said, conversion between them - as long as data are machine-readable with well-defined metadata - is straightforward.